Due to confidentiality agreements, this represents only a very small sample of work accomplished.
November 2021 Flood Event & Forestry
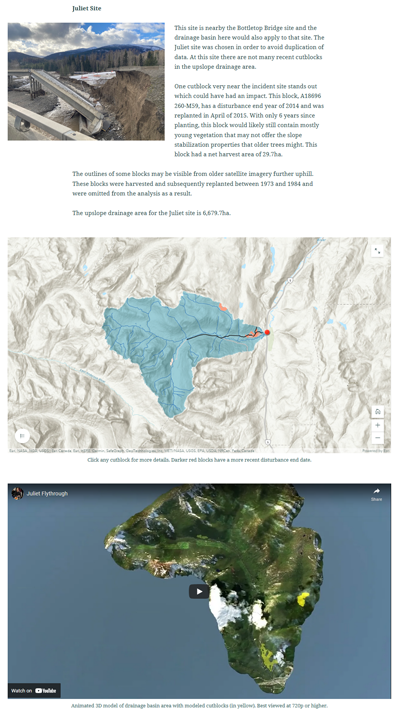
This project for a BCIT course was a multi-faceted approach to building an online dashboard to help facilitate public discussion after a natural or industrial disaster. It incorporates stream and watershed analyses, interactive mapping tools, and 3D modelling, among other techniques to present complex data for a wide audience. Analysis was performed primarily in QGIS and utilized Autodesk Infraworks and ArcGIS Online tools.
BC Ridings & FSAs
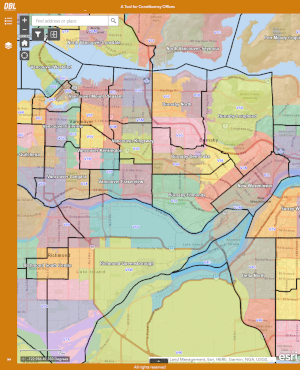
This project was an interactive mapping application built with ArcGIS Online for a course at BCIT. It provides an easy way for staff at the constituent offices of BC MLAs to quickly identify what riding a caller or visitor might be in by their address or the Forward Sortation Area part of a postal code in order to direct them to the correct resources.
Nissan LEAF Battery Degradation
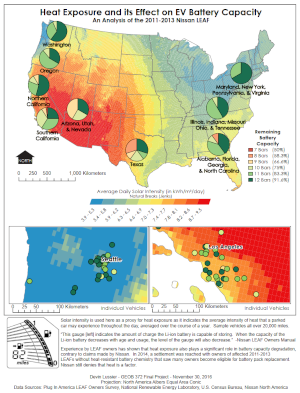
This project, undertaken in ArcGIS Desktop and Adobe Illustrator, for a course at UBC utilized data from Plug In America and the National Renewable Energy Laboratory, among others, to demonstrate the effect of heat on battery degradation in Nissan LEAF electric vehicles.
Squilax-Anglemont Road Moose Crossing
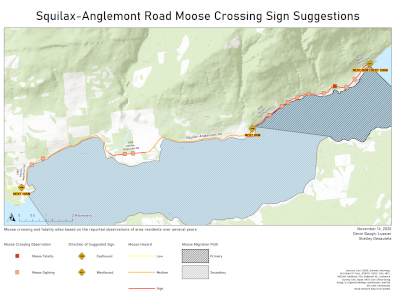
Residents in the north shore area of Shuswap Lake were concerned about the safety of young moose making their migration across the lake after one was struck and killed by a car in August 2020. This map was created, based on resident observations, to support a petition to the BC Ministry of Transportation to install warning signs along Squilax-Anglemont Road.
Municipal Transit Geodatabase Design
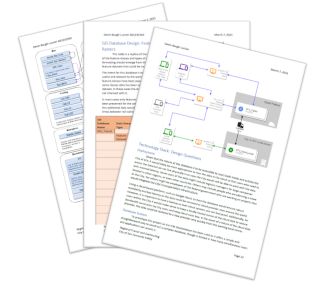
This geodatabase design proposal was created as the term project for a BCIT course and focused on storing transit, demographic, and other municipal data for the San Fernando Valley neighbourhoods of the City of Los Angeles. The proposal included an analysis of potential business applications, user types and permissions, a technology stack evaluation and design diagram, a conceptual ERD, and a working model of the database constructed in ArcGIS Pro.
Howe Sound Tourist Map
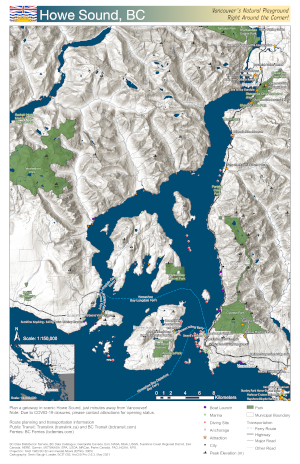
This tourist map was created in ArcGIS Pro for a BCIT course and highlights tourist attractions and marine activites, such as diving sites and boat launches.
Vancouver Buses Interactive Data Tool
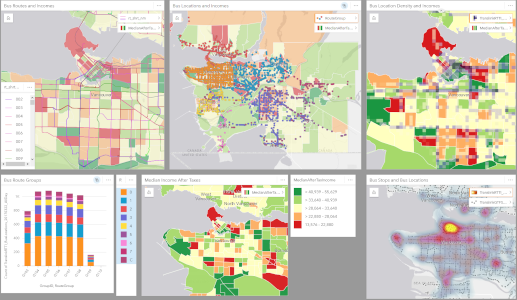
This project for a BCIT course was built in ArcGIS Insights and allows the user to interactively analyze data about bus stops, frequency, and timing along with demographic data for use in planning and transit equity research.